Google Analytics: The Top 3 Things to Check Out
A note about this post: As you’ve likely heard, Google is transitioning their analytics platform from Universal Analytics (UA) to Google Analytics 4 (GA4). We highly encourage you to get that new code snippet installed on your website so it can start collecting data. Google recently announced that UA is on the way out, and will be shuttered entirely by July 2023.
Google’s analytics data runs deep and it’s easy to get overwhelmed with so much information to parse. To help you focus in and not get lost in an analytics wormhole, here are the top 3 places (we love lists!) we investigate when reviewing analytics to spend our time effectively and efficiently:
- Real time review
- All pages
- Source / medium
1. real time review
When reviewing our client’s sites and campaigns, we use real time testing to verify that everything is set up correctly and firing properly. We’re able to easily test, because we have staff in multiple states who are almost always in a different area than the client site or campaign we’re viewing. But even without this option, most businesses are likely to have staff whose IP addresses register in a different market.
You can ask staff with an out-of-market IP address to get to the website by a few means; by typing the url, by searching and clicking on a Google Search Ad, or finding a social ad in the wild, if possible. As the screenshot illustrates, you can determine the referral source, keyword used, and location of the visitor to be sure GTM, Tags, and pixels are functioning properly.
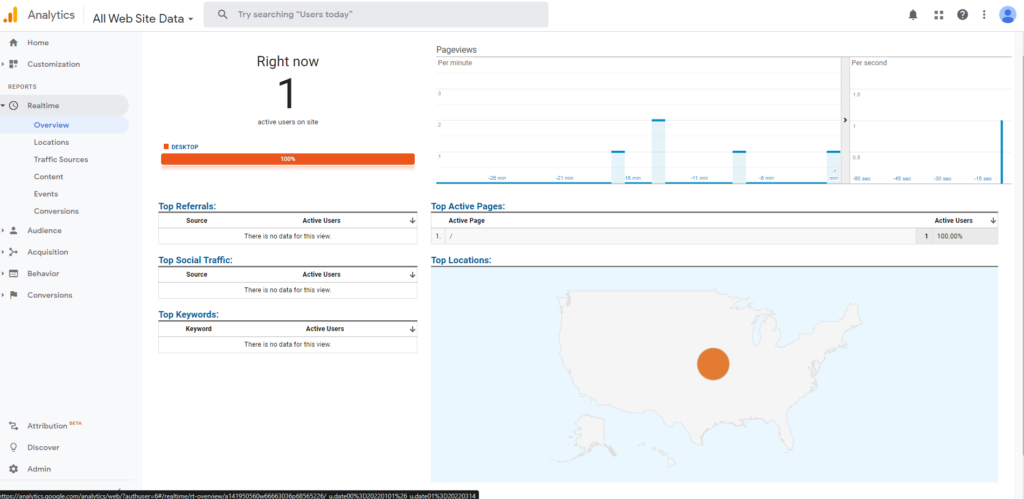
In this example, our client is on the East Coast and we had a staffer in the Midwest type in the client URL. As we would expect to see here, there’s no referral source since the website was directly keyed in. If this visitor was’t one of our staff and traffic was coming from that location repeatedly, it would clue us in that we’re getting traffic outside of our target market and might lead us to investigate its source.
2. all pages
The all pages view serves to help us understand what people are actually doing when they land on your website and what site content is most popular (or unpopular.)
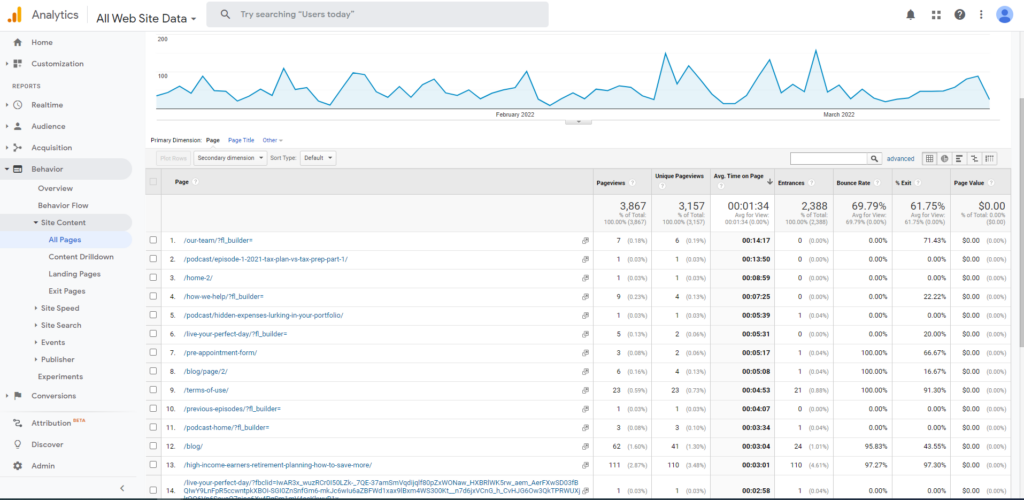
This screenshot is from the analytics of a financial advisory client. By clicking on the column heading, you’re able to sort the information from highest to lowest and understand more about each of those metrics.
For instance, in this screenshot you’ll see “Avg. Time on Page” is selected and the data is sorted from longest average time on page to shortest. This gives us a little insight into what our visitors are doing by telling us about how long they’re spending on each page. If we were to click into the “Pageviews” column, we’d see which of our pages is most viewed and that can help us understand our most popular content. If (like this business) you have a client portal that you know people are actively logging into on a daily basis, it would be reasonable to see that page have a high volume of page views and a high bounce rate.
A mention of bounce rate leads us to an interesting discussion. Without diving deeper, people may view a high bounce rate as a negative thing when this isn’t exclusively the case. While having a site visitor bounce immediately can signal certain pages aren’t performing well, in many other instances it actually points to people behaving exactly as we want them to. For instance, most contact forms, client portals, and even some website homepages are meant to be feeders to other parts of the website where a bounce can signal that the desired action occurred.
Understanding website performance by looking at individual pages, how long people are visiting them, and if they’re taking the desired action is necessary before diving into campaign performance. We can send tons of web traffic to a site by way of a stellar digital ad campaign, but if your website doesn’t allow your end user to easily take the desired action–your ad dollars and effort may be spent in vain.
3. source / medium
Viewing Source/Medium within GA has the potential to tell us several data stories we care about. In a nutshell, it can help us understand where people are coming from and how our marketing campaign traffic is performing.
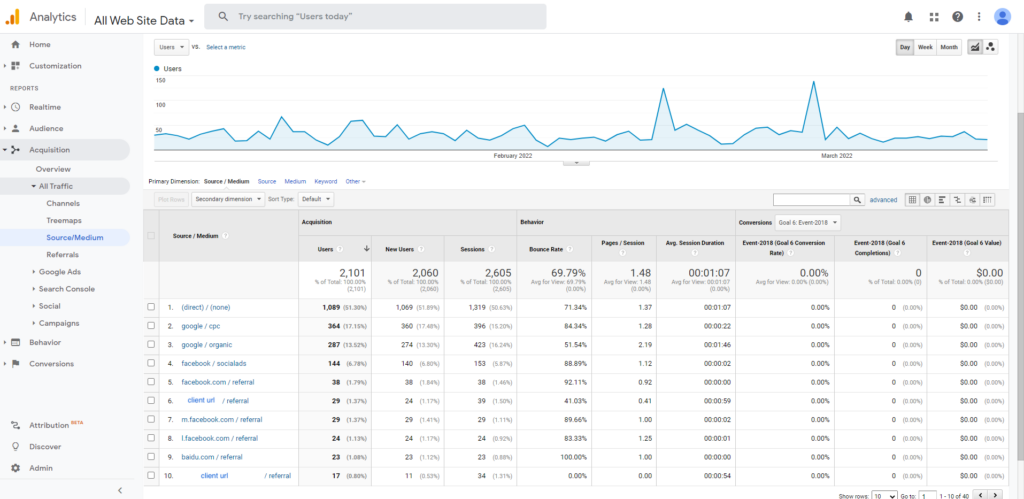
In the screenshot above, you can see in the far left column “Source / Medium” which describes where traffic is coming from and in the “Users” column it details how many visitors make up each of those pools. So for instance, going with our same financial advisory example the #1 source of visits is a direct url type (which makes sense for a company with an active user portal for their existing clients), #2 is the paid search campaign they are running, and #3 is organic search. Following the top three, you begin to see some other digital campaigns such as #4 Facebook social ads, etc.
If you wanted to explore which of your campaign elements are doing best, this can be a bit of a loaded question. This depends upon what you care about most, and what kind of result is worth more to you. Generally speaking, people tend to believe the campaign with the highest volume is performing best when this isn’t always entirely true. Search traffic tends to be more engaged and have a higher volume while Facebook traffic might view your site and bounce, and this is by design. In this case, the paid Facebook campaigns we see here are intentionally targeted awareness campaigns guiding prospects into the sales funnel. These campaigns have been at work on prospects, and have likely contributed to their Search traffic being ready to make a buying decision.
While Universal Analytics and Google Analytics 4 both have a vast (seemingly never ending) supply of data to dive into, these 3 areas should give you a helpful overview to understand where your site and campaigns are at. As the transition to GA4 becomes more widespread and Google begins to phase out UA, be on the lookout for future posts about the difference between these two resources!
Go forth. Go digital.
-cohort.crew