What does it all mean?

Don’t you just hate it when someone tells you how great they are by comparing themselves to someone else and tearing them down? It can feel small, baseless, and petty.

Unless we’re talking about her. This strikes the perfect level of petty.
That said, sometimes experiences of what you don’t want can strongly influence the things you do want. We know our industry is rife with smoke screens and lingo, sometimes deliberately used to complicate the simple or exaggerate the work required in the straight forward. When scanning the general digital landscape, we’ve learned these are the traits we do not want to embody. Transparency isn’t just a buzz word meant to help capture new business–it’s a tenant we’ve built into our daily processes and ongoing campaigns.
Below are our thoughts on an approach to transparency in digital marketing, as well answers to questions we’ve received from clients over the years on how to interpret data and lingo.
transparency in reporting
Whether seeking a digital partner or looking to generate in-house reports for your team, we have strong feelings about the proper approach to reporting. Often campaigns are omni-channel and require the use of a third-party dashboard to compile all results into one place. This can be done with free, built-in platform tools like Google Data Studio, or through a number of paid providers. Be warned, finding a reliable dashboard provider isn’t for the faint of heart. Over the years we’ve used many and spent hours upon hours testing, using, and reviewing dozens. Ultimately the right dashboard provider will be determined by your unique needs, but here are a few things we recommend looking for when making this decision:
- Does the dashboard pull in as close to real-time data as possible?
- Does the dashboard have API (Application Programming Interfaces) pulls, allowing data to easily and automatically flow from the platform to your dashboard? (Manual uploads suck, FYI.)
- Is the dashboard customizable to suit your needs?
- Is it accurately and reliably pulling in data?
- Does it support the platforms you most commonly place media on?
Here’s an example of what you might see in a pretty common dashboard at cohort.digital:
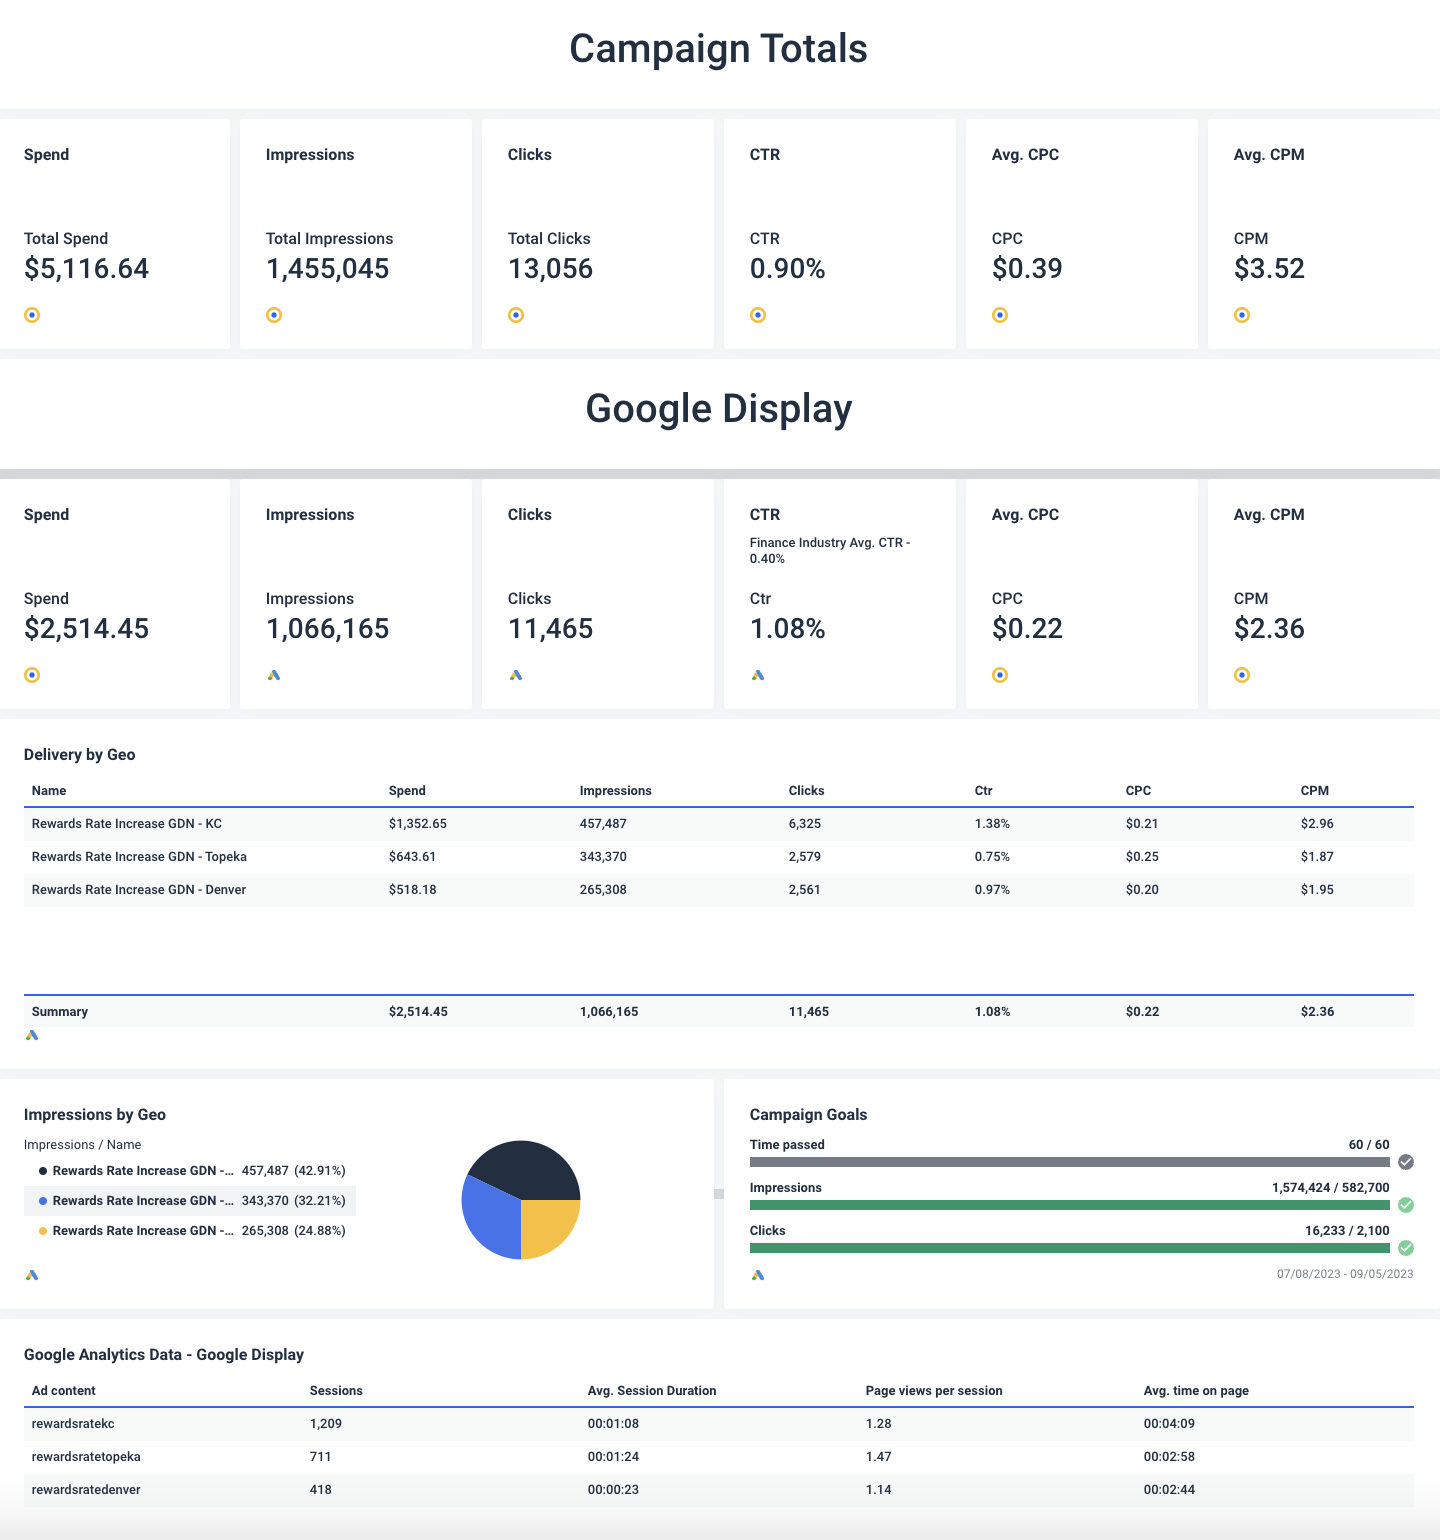
What you see here is the top portion of an omni-channel dashboard with the total spend, impressions, clicks, CTR, CPC, and CPM (don’t worry, we dive into these acronyms below!) all called out at the top. Below that, the dashboard breaks out performance for each individual platform in greater detail. This allows us and our clients to view what’s happening up to within the last 24 hours. Information is broken out at the campaign level, platform level, and ad level. This is valuable, because if something is really over or underperforming our clients and internal team are both empowered to ask questions or suggest campaign changes.
reporting & insight terminology
Some of the most frequent questions we get surround acronyms and the definitions of terminology. Knowing and understanding the lingo is the first step to being able to think through dashboards, reporting, and insights in order to interpret the data. Here are some of the most frequently used terms:
- Impressions – An impression is the number of times your message is rendered to your audience for potential delivery. This may be via a device, screen, or environment, and may be visual and/or audible.
- Impression v. Partial impression (also, View v. Partial view.) – An impression is served for potential delivery, meaning it may be delivered but not seen or seen in full by your audience. A partial impression or partial view is when your ad is seen but not in its entirety. This could mean only seeing a static ad for long enough to register a portion of it but not view all of the content, or watching or listening to some but not all of an audio/video ad.
- Click & Click Through Rate (CTR) – A click is considered to be a user pressing the designated link in an ad campaign. CTR is the percentage of impressions that resulted in clicks.
- View & View Through Rate (VTR) – A view may be completed or partial. VTR is the percentage of completed views taken from total views.
- Frequency – The number of times a user is exposed to an ad.
- Cost per Click/Cost per View – the amount an advertiser spends for a given click or view. As it relates to views, many platforms will only charge advertisers for completed views or specify how they charge for partial views.
- Events and Conversions – these may be small or large actions we want users to take on the site. An event can be anything from viewing a page to submitting a form. Conversions may be micro or the primary action we want someone to take, such as making a purchase.
Our dashboards can be filtered to view any desired period, such as a given day, week, month, or the whole campaign. As pictured above, we typically provide the following overview detail:
- Total spend – the dollar amount spent in a designated period.
- Total impressions – the total number of impressions served during a designated period.
- Total Clicks – the total number of clicks generated during a designated period.
- Total CTR – the percentage of users who were exposed to an ad and also clicked through to the landing page in that designated period.
- Total CPC – the average cost per click during the designated period.
- When there is engagement data, such as post likes, shares, or comments, these are called out.
- When there are conversions/micro-conversions such as purchases, submitted forms, etc., we include the average cost per conversion.
widget breakdowns
Each widget includes a breakdown of performance by creative, breaking out spend, impressions, clicks, CTR, average CPC per ad, and in summary for the platform.
Breaking out data in this way allows us to see how each ad is performing. From this we can glean how individual ad performance contributes to channel performance, and how individual channel performance contributes to campaign performance. With this information we are able to determine if and how to flight ads to optimize channel performance, as well as how to distribute budget per ad and/or per channel to optimize overall campaign performance.
a deeper dive using analytics
Depending upon the need and situation, we sometimes feed more detailed Google Analytics data into our dashboards. This requires our team to have GA4 access and for the active platforms being used in the campaign to be properly connected. Here’s additional information that we sometimes feed into dashboards for deeper exploration, and without the dashboard connection you can always view this information directly within your GA4 account.
- Engaged Session – a session where a user interacts with multiple pages or takes action on your website.
- Average Session Duration – the average amount of time a user spent on the site. There is not one ideal length of session duration, it varies based on campaign goals. What is ideal for a given campaign would be the amount of time needed to interact with the site and take the desired action(s).
- Bounce Rate – the number of users who leave a website. On the surface, this metric may feel negative if it is relatively high. This isn’t always the case, however, if some of your goals involve encouraging users to “bounce” to third party sites. We include this because it may still be in use where old UA accounts are lingering, but we share to give notice that GA4 is no longer supporting or providing this metric. RIP.
- Views – this may involve one user viewing multiple pages or the number of times an individual page is viewed by a new user, which UA previously broke out as page views and unique page views, respectively. Going forward GA4 will break this out differently, and each can be found in the ‘Landing Page’ or ‘Pages & Screens’ tables.
Our goal in every interaction, whether with a prospect, client, or someone who randomly stumbled onto our site is to demystify digital. Hopefully this serves as a broad stroke look at much of the data we talk about on a daily basis, but in some ways it only scratches the surface when it comes to interpreting all of the above. If you’re curious, have questions, or just want to chat because you like data as much as we do – hit us up!
Go Forth. Go Digital.
-cohort.crew